pystrat package
Submodules
pystrat.pystrat module
- class pystrat.pystrat.Fence(sections, datums=None, correlations=None, coordinates=None)[source]
Bases:
objectFence diagram class.
Organizes sections according to a shared datum.
This class permits plotting of fence diagrams.
- Parameters:
sections (1d array_like) – List of Sections to be put into the fence
datums (1d array_like, optional) – If not specified, the datum for each section will be the bottom. If specified, must be list of same length as number of sections with heights in each section for the datum.
correlations (2d array_like, optional) – Each column is a correlated horizon where the rows are the heights of this horizon in each section. will plot as a line between fence posts. Default is no correlations.
coordinates (1d array_like, optional) – 1D coordinates of sections, reflecting distance between them. Distances between sections will be used to scale the plotting distances in the fence diagram.
- sections
List of sections in the fence diagram
- Type:
1d array_like
- datums
Datum for each section
- Type:
1d array_like
- correlations
Correlated horizons
- Type:
2d array_like
- coordinates
Coordinates of sections
- Type:
1d array_like
- plot(style, fig=None, sec_wid_fac=1, col_buffer_fac=0.2, sec_data_buf_fac=0.3, distance_spacing=False, plot_distances=None, distance_labels=False, distance_labels_style=None, plot_correlations=False, data_attributes=None, data_attribute_styles=None, attribute_axis_full=False, section_plot_style=None, sec_names_rotate=True, sec_names_fontsize=10, **kwargs)[source]
Plot a fence diagram
- Parameters:
style (Style) – A Style object.
fig (matplotlib.figure.Figure, optional) – Figure to plot into if desired, by default None. If None, will create and return a new figure.
sec_wid_fac (float, optional) – Ratio of section axis width to data attribute axes widths, defaults to 1. A value of 1 means that the section axis is the same width as the data attribute axes. Values less than 1 mean that the section axis is narrower than the data attribute axes.
col_buffer_fac (float, optional) – Fraction of section width used to buffer between columns in the fence, defaults to 0.2. A value of 0 means no buffer and columns immediately abut each other.
sec_data_buf_fac (float, optional) – Fraction of section width used to buffer between section axes and data attribute axes, defaults to 0.3
distance_spacing (boolean, optional) – Whether or not to scale the distances between sections according to the distances between self.coordinates, or plot_distances, if set. Default is False. If False, then sections are equally spaced.
plot_distances (1d array-like, optional) – Distances between sections to use for plotting. Default is None. If None, then distances are calculated from coordinates. If set, then length (n_sections - 1).
distance_labels (1d array-like or boolean, optional) – Labeling of distances between sections. Default is False. If False, no labels are plotted. If True, labels are plotted with the actual distances between sections (based on coordinates). If an array-like, then length must be (n_sections - 1) and values specify manual labeling of distances.
distance_labels_style (dictionary, optional) – Style dictionary for distance labels. Default is None. If None, a default style is used. Dictionary is passed to matplotlib.pyplot.annotate.
plot_correlations (boolean, optional) – Whether or not to plot correlated horizons. Default is False; this parameter is ignored if correlations is None.
data_attributes (1d array-like, optional) – List of data attributes to plot. Default is None. If None, no data attributes are plotted. If the attribute is not defined for a particular section, it is not plotted.
data_attribute_styles (1d array-like, optional) – Style dictionary or dictionaries to use to plot data attributes. Defaults to None, in which case a default style is used. Either same length as data_attributes, or length of one. If length of one, then the same style is used for all data attributes.
attribute_axis_full (boolean, optional) – Whether data attribute axes should take the full axis height (True) or only the height of the section (False). Default is False. If False, the data attribute axes will be the same height as the section.
section_plot_styles (dictionary, optional) – Dictionary of style parameters passed to section plotting. Default is None. If None, a default style is used.
sec_names_rotate (boolean, optional) – whether to plot section names vertically (True) or horizontally above columns in fence. Default is True.
sec_names_fontsize (float, optional) – Fontsize for section names. Default is 10.
- Returns:
fig (matplotlib.pyplot.Figure) – Returned if no figure is provided
axes (list) – List of matplotlib axes objects for each column.
axes_dat (list) – List of matplotlib axes objects for data attribute. Returned if data_attributes is not None. Each entry in the list is a list of axes for each data attribute. Sections with no data attributes will have a None entry.
- class pystrat.pystrat.Section(thicknesses, facies, name=None, annotations=None, units=None)[source]
Bases:
objectStratigraphic section class.
Organizes all data associated with a single stratigraphic section.
- Parameters:
thicknesses (1d array_like) – Thicknesses of the facies. Any NaNs will be automatically removed.
facies (1d array_like) – Observed facies. Any NaNs will be automatically removed.
name (str, optional) – Name of the section. Default is None.
annotations (pandas.DataFrame, optional) – DataFrame with columns ‘height’ and ‘annotation’. Heights correspond to stratigraphic heights at which to plot annotations. Annotations are .png files in the annotations folder. Default is None.
units (numpy.ndarray, optional) – Array of unit names for labeling intervals such as groups, formations, members, etc. Each bed in the section must have a name. Each column in units corresponds to a level of labeling (e.g. group, formation, member). Long dimension of the array must be len(thicknesses). Default is None.
- top_height
Top height of each unit.
- Type:
1d array_like
- base_height
Base height of each unit.
- Type:
1d array_like
- unit_number
Number of each unit.
- Type:
1d array_like
- unique_facies
Unique facies in the section.
- Type:
1d array_like
- class Data(attribute_height, attribute_values)[source]
Bases:
objectThis nested class stores any data tied to the stratigraphic height, but not explicitly tied to the stratigraphic units.
A typical example of such data would be chemostratigraphic data.
- Parameters:
attribute_height (1d array_like) – The stratigraphic heights at which the attribute were generated.
attribute_values (1d array_like) – The attribute values.
- height
The stratigraphic heights at which the attribute were generated.
- Type:
1d array_like
- values
The attribute values.
- Type:
1d array_like
- add_data_facies(section)[source]
Deprecated since version 2.0: Functionality will be changed in future versions.
Extract the facies associated with each data point.
- Parameters:
section (Section) – The parent Section object for this Data object. (While the parent Section object is already implied for any given Data object, accessing the Section object’s attributes is not elegant, so we pass it as an argument for now…)
Notes
Samples marked with a .5 in the ‘unit’ column come from unit boundaries. User input is required to assign the correct unit.
If the sample comes from the lower unit, subtract 0.5. If the sample comes from the upper unit, add 0.5.
- add_height_attribute(attribute_name, attribute_values)[source]
Add an attribute that is tied to the stratigraphic heights of this instance of Data.
A typical example would be the sample names associated with a given chemostratigraphic profile.
- Parameters:
attribute_name (string) – The name of the attribute.
attribute_values (1d array_like) – The attribute values. NaNs are accepted.
- clean_data_facies(section)[source]
Deprecated since version 2.0: Functionality will be changed in future versions.
Extract the facies associated with each data point AFTER cleaning up the samples that are from unit boundaries using Data.clean_data_facies_helper().
- Parameters:
section (Section) – The parent Section object for this Data object. (While the parent Section object is already implied for any given Data object, accessing the Section object’s attributes is not elegant, so we pass it as an argument for now…)
- clean_data_facies_helper(data_name)[source]
Deprecated since version 2.0: Functionality will be changed in future versions.
Prints the code for cleaning up data points on unit boundaries.
- Parameters:
data_name (string) – Variable name used for the Data object (e.g. ‘section_01.data_01’).
Notes
Copy and paste the printed code into a cell and edit as follows:
If the sample comes from the lower unit, subtract 0.5. If the sample comes from the upper unit, add 0.5
After fixing all changes, copy and paste the dataframe into the data .csv.
- add_data_attribute(attribute_name, attribute_height, attribute_values)[source]
Add an attribute that is tied to the stratigraphic height, but not explicitly tied to the stratigraphic units.
A typical example of such data would be chemostratigraphic data.
- Parameters:
attribute_name (string) – The name of the attribute.
attribute_height (1d array_like) – The stratigraphic heights at which the attribute were generated.
attribute_values (1d array_like) – The attribute values.
- add_facies_attribute(attribute_name, attribute_values)[source]
Add an attribute that is explicitly tied to the stratigraphic units.
This function should only be used to add an attribute which corresponds 1:1 with each measured unit. Typically, such attributes would add additional detail (e.g. grain size or bedforms) to the broad facies description of the unit.
To add an attribute that is tied to the stratigraphic height, but not explicitly tied to the stratigraphic units (e.g. chemostratigraphic data), use the Data subclass via the method add_data_attribute().
To add an attribute that is neither tied to the stratigraphic height nor the stratigraphic units (e.g. the GPS coordinates of the start and end of the section), use add_generic_attribute().
- Parameters:
attribute_name (string) – The name of the attribute.
attribute_values (1d array_like) – The attribute values. NaNs are accepted.
- add_generic_attribute(attribute_name, attribute_values)[source]
Add an attribute that is neither tied to the stratigraphic height nor the stratigraphic units.
To add an attribute that is explicitly tied to the stratigraphic units, use add_facies_attribute().
To add an attribute that is tied to the stratigraphic height, but not explicitly tied to the stratigraphic units (e.g. chemostratigraphic data), use the Data subclass via the method add_data_attribute().
- Parameters:
attribute_name (string) – The name of the attribute.
attribute_values (any) – The attribute values.
- get_units(heights)[source]
Return unit(s) at requested height(s). Units must be defined. If multiple units are defined, all are returned.
- Parameters:
heights (float or array_like) – Height(s) at which to query units
- Returns:
units – Unit(s) at queried height(s)
- Return type:
array-like
- plot(style, ax=None, linewidth=1, annotation_height=0.15, label_units=False, unit_label_wid_tot=0.2, unit_fontsize=8, xticks=True)[source]
Plot this section using a Style object.
- Parameters:
style (Style) – A Style object.
ax (matplotlib axis) – Axis in which to plot, if desired. Otherwise makes a new axes object. AXIS LIMITS MUST BE APPLIED IN ADVANCE FOR SWATCHES TO PLOT CORRECTLY
linewidth (float) – The linewidth when drawing the stratigraphic section.
annotation_height (float, optional) – The height in inches for annotation graphics. Defaults to 0.15. Set to zero to not plot annotations.
label_units (boolean, optional) – Whether or not to label units on the left. Default is False. If True, then section must have unit names specified.
unit_label_wid_tot (float, optional) – Fractional width of the space to label units (if provided) on the left of the column. Default is 0.2.
unit_fontsize (float, optional) – Fontsize for labeling units. Default is 8.
xticks (boolean, optional) – Whether or not to label xticks and make associated vertical lines. Default is True.
- plot_data_attribute(attribute, ax=None, style=None, clean=True)[source]
Plot a data attribute
- Parameters:
attribute (str) – Name of the data attribute to plot
ax (matplotlib.axes._axes.Axes, optional) – Axis to plot into, by default None. If None, will create a new axis and return it.
style (dict, optional) – Plotting style dictionary compatible with matplotlib.pyplot.plot, by default None. If None, a default style will be used.
clean (bool, optional) – Whether or not to clean up the axes, by default True. If True, will remove the y-axis and the top and right spines.
- Returns:
ax – Returned if no axis is provided
- Return type:
- return_facies_dataframe()[source]
Return a Pandas DataFrame of all attributes associated with the stratigraphic units.
- Parameters:
None.
- Returns:
df – Pandas DataFrame with all attributes associated with the stratigraphic units.
- Return type:
DataFrame
- class pystrat.pystrat.Style(labels, color_values, width_values, swatch_values=None, annotations=None, swatch_wid=1.5)[source]
Bases:
objectSection plotting style class.
Organizes the plotting style for the lithostratigraphy, including colors, width, swatches, and annotations.
- Parameters:
labels (1d array_like) – The labels to which colors and widths are assigned. When plotting a Section, values within the facies of that Section must form a subset of the values within this array_like.
color_values (array_like) – The colors that will be assigned to the associated labels. Values must be interpretable by matplotlib.
width_values (1d array_like of floats) – The widths that will be assigned to the associated labels. Values must be between 0 and 1.
swatch_values (1d array-like of int) – USGS swatch codes (see swatches/png/) for labels. Give zero for no swatch.
annotations (list, dict, or None) – Specification of annotations to plot alongside sections, by default None. If None, no annotations are plotted. User can also provide a list of annotation names to select among the default annotations to plot. See
Style.plot_default_annotations()for the default annotations provided by pystrat. Alternatively, the user can provide a dictionary linking annotation names to png file paths for plotting custom annotations.swatch_wid (float (default 1.5)) – Width of the swatch pattern in inches.
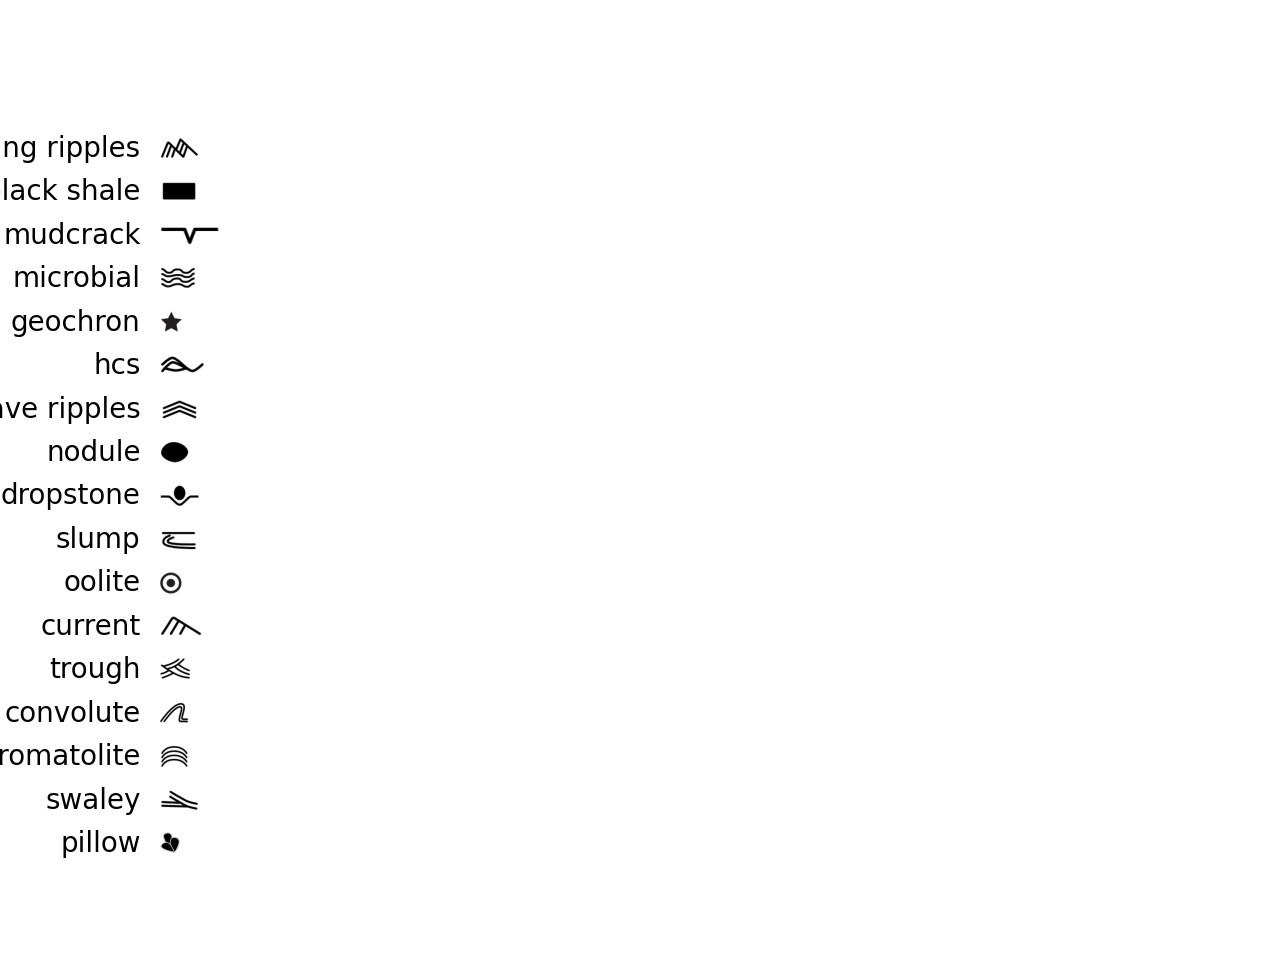
- static plot_default_annotations(ax=None)[source]
Plot annotations provided by pystrat.
- Parameters:
ax (matplotlib.pyplot.axes, optional) – Axes to plot into, by default None. If None, creates an axis.
Examples
import pystrat
pystrat.Style.plot_default_annotations()
(
Source code,png,hires.png,pdf)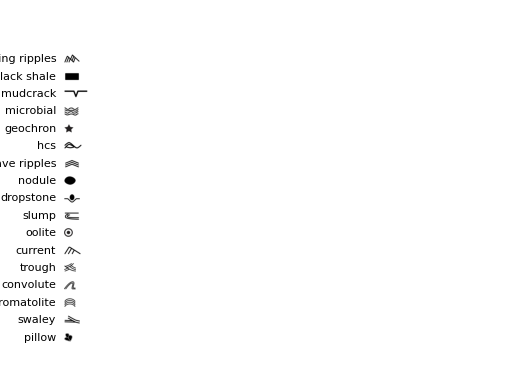
- plot_legend(ax=None, legend_unit_height=0.25, fontsize=10, annotations_loc='bottom', facies_order=None)[source]
Plot a legend for this Style object.
- Parameters:
legend_unit_height (float) – A scaling factor to modify the height of each unit in the legend only.
ax (matplotlib.Axes, optional) – Axis to plot into, defaults to None. If None, creates an axis.
fontsize (float (default 10)) – Fontsize for text in the legend.
annotations_loc (str (default 'right')) – Location of the annotations, default is ‘bottom’. Options are ‘right’, ‘bottom’, or ‘top’.
facies_order (1d array_like, optional) – Order in which to plot facies in the legend. If None, sorts by width.
- Returns:
fig (matplotlib Figure) – Figure handle.
ax (matplotlib Axes) – Axis handle.
- pystrat.pystrat.attribute_convert_and_check(attribute)[source]
Convert pandas series to arrays (if necessary) and check that the data are 1d.
This function assists the addition of attributes to Section and Data.
- Parameters:
attribute (1d array_like) – The attribute to be added.
- Returns:
attribute – The attribute after the conversion and check.
- Return type:
1d array
- pystrat.pystrat.findseq(x, val, noteq=False)[source]
Find sequences of a given value within an input vector.
- Parameters:
- Returns:
idx – Array that contains in rows the number of total sequences of val, with the first column containing the begin indices of each sequence, the second column containing the end indices of sequences, and the third column contains the length of the sequence.
- Return type:
array
- pystrat.pystrat.get_axis_aspect(ax)[source]
Returns the aspect ratio of the axis in terms of inches per data unit for each axis
- Parameters:
ax (axis handle)
- Returns:
aspect – aspect ratio of the axis
- Return type:
- pystrat.pystrat.get_inch_per_dat(ax)[source]
Returns the inches per data unit of the given axis (x, y)
- Parameters:
ax (axis handle)
- Returns:
x_inch_per_dat (float) – inches per data unit in x
y_inch_per_dat (float) – inches per data unit in y
- pystrat.pystrat.plot_annotation(annotation_path, pos, height, ax)[source]
Plot a png of an annotation.
- Parameters:
annotation_path (str) – Path to the file of the annotation
pos (1d array_like) – left and bottom of the annotation plotting, data units [x0, y0]
height (numeric) – vertical thickness to plot (vertical extent will be y0 to y0 + height)
ax (matplotlib axis) – axis in which to plot
- pystrat.pystrat.plot_swatch(swatch_code, extent, ax, swatch_wid=1.5, warn_size=False)[source]
Plot a tesselated USGS geologic swatch to fit a desired extent
- Parameters:
swatch_code (int) – USGS swatch code
extent (1d array_like) – rectangular area in which to tesselate the swatch [x0, x1, y0, y1]
ax (matplotlib axis) – axis in which to plot
swatch_wid (float) – width of original swatch image file in inches
warn_size (boolean (default: False)) – Whether or not to issue warnings on swatch sizes.